

By David Rose, UK Mail online
The bitter winter afflicting much of the Northern Hemisphere is only the start of a global trend towards cooler weather that is likely to last for 20 or 30 years, say some of the world’s most eminent climate scientists.
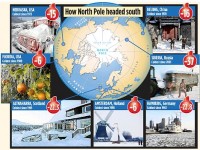
Enlarged here.
Their predictions - based on an analysis of natural cycles in water temperatures in the Pacific and Atlantic oceans - challenge some of the global warming orthodoxy’s most deeply cherished beliefs, such as the claim that the North Pole will be free of ice in summer by 2013.
According to the US National Snow and Ice Data Centre in Colorado, Arctic summer sea ice has increased by 409,000 square miles, or 26 per cent, since 2007 - and even the most committed global warming activists do not dispute this.
The scientists’ predictions also undermine the standard climate computer models, which assert that the warming of the Earth since 1900 has been driven solely by man-made greenhouse gas emissions and will continue as long as carbon dioxide levels rise. They say that their research shows that much of the warming was caused by oceanic cycles when they were in a ‘warm mode’ as opposed to the present ‘cold mode’.
This challenge to the widespread view that the planet is on the brink of an irreversible catastrophe is all the greater because the scientists could never be described as global warming ‘deniers’ or sceptics. However, both main British political parties continue to insist that the world is facing imminent disaster without drastic cuts in CO2.
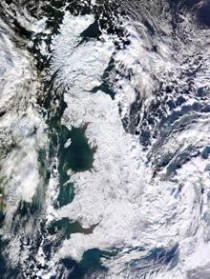
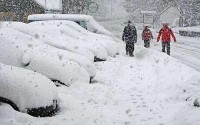
This image of the UK taken from NASA’s multi-national Terra satellite on Thursday shows the extent of the freezing weather
Last week, as Britain froze, Climate Change Secretary Ed Miliband maintained in a parliamentary answer that the science of global warming was ‘settled’.
Among the most prominent of the scientists is Professor Mojib Latif, a leading member of the UN’s Intergovernmental Panel on Climate Change (IPCC), which has been pushing the issue of man-made global warming on to the international political agenda since it was formed 22 years ago.
Prof Latif, who leads a research team at the renowned Leibniz Institute at Germany’s Kiel University, has developed new methods for measuring ocean temperatures 3,000ft beneath the surface, where the cooling and warming cycles start. He and his colleagues predicted the new cooling trend in a paper published in 2008 and warned of it again at an IPCC conference in Geneva last September.
Last night he told The Mail on Sunday: ‘A significant share of the warming we saw from 1980 to 2000 and at earlier periods in the 20th Century was due to these cycles - perhaps as much as 50 per cent. They have now gone into reverse, so winters like this one will become much more likely. Summers will also probably be cooler, and all this may well last two decades or longer. The extreme retreats that we have seen in glaciers and sea ice will come to a halt. For the time being, global warming has paused, and there may well be some cooling.’
As Europe, Asia and North America froze last week, conventional wisdom insisted that this was merely a ‘blip’ of no long-term significance. Though record lows were experienced as far south as Cuba, where the daily maximum on beaches normally used for winter bathing was just 4.5C, the BBC assured viewers that the big chill was merely short-term ‘weather’ that had nothing to do with ‘climate’, which was still warming.
The work of Prof Latif and the other scientists refutes that view. On the one hand, it is true that the current freeze is the product of the ‘Arctic oscillation’ - a weather pattern that sees the development of huge ‘blocking’ areas of high pressure in northern latitudes, driving polar winds far to the south.
Meteorologists say that this is at its strongest for at least 60 years. As a result, the jetstream - the high-altitude wind that circles the globe from west to east and normally pushes a series of wet but mild Atlantic lows across Britain - is currently running not over the English Channel but the Strait of Gibraltar.
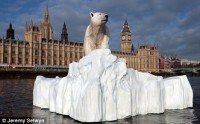
A composite photograph released last year to highlight the issue of melting ice and global warming
However, according to Prof Latif and his colleagues, this in turn relates to much longer-term shifts - what are known as the Pacific and Atlantic ‘multi-decadal oscillations’ (MDOs). For Europe, the crucial factor here is the temperature of the water in the middle of the North Atlantic, now several degrees below its average when the world was still warming.
But the effects are not confined to the Northern Hemisphere. Prof Anastasios Tsonis, head of the University of Wisconsin Atmospheric Sciences Group, has recently shown that these MDOs move together in a synchronised way across the globe, abruptly flipping the world’s climate from a ‘warm mode’ to a ‘cold mode’ and back again in 20 to 30-year cycles.
‘They amount to massive rearrangements in the dominant patterns of the weather,’ he said yesterday, ‘and their shifts explain all the major changes in world temperatures during the 20th and 21st Centuries. We have such a change now and can therefore expect 20 or 30 years of cooler temperatures.’ Prof Tsonis said that the period from 1915 to 1940 saw a strong warm mode, reflected in rising temperatures.
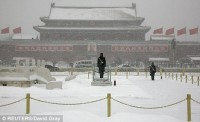
Pictures of the snow in Tiananmen Square in Beijing, China, last week show the city is the coldest it has been since 1970
But from 1940 until the late Seventies, the last MDO cold-mode era, the world cooled, despite the fact that carbon dioxide levels in the atmosphere continued to rise. Many of the consequences of the recent warm mode were also observed 90 years ago. For example, in 1922, the Washington Post reported that Greenland’s glaciers were fast disappearing, while Arctic seals were ‘finding the water too hot’. It interviewed a Captain Martin Ingebrigsten, who had been sailing the eastern Arctic for 54 years: ‘He says that he first noted warmer conditions in 1918, and since that time it has gotten steadily warmer. Where formerly great masses of ice were found, there are now moraines, accumulations of earth and stones. At many points where glaciers formerly extended into the sea they have entirely disappeared. As a result, the shoals of fish that used to live in these waters had vanished, while the sea ice beyond the north coast of Spitsbergen in the Arctic Ocean had melted. Warm Gulf Stream water was still detectable within a few hundred miles of the Pole.’
In contrast, Prof Tsonis said, last week 56 per cent of the surface of the United States was covered by snow. ‘That hasn’t happened for several decades,’ he pointed out. ‘It just isn’t true to say this is a blip. We can expect colder winters for quite a while.’ He recalled that towards the end of the last cold mode, the world’s media were preoccupied by fears of freezing. For example, in 1974, a Time magazine cover story predicted ‘Another Ice Age’, saying: ‘Man may be somewhat responsible - as a result of farming and fuel burning [which is] blocking more and more sunlight from reaching and heating the Earth.’
Prof Tsonis said: ‘Perhaps we will see talk of an ice age again by the early 2030s, just as the MDOs shift once more and temperatures begin to rise.’ Like Prof Latif, Prof Tsonis is not a climate change ‘denier’. There is, he said, a measure of additional ‘background’ warming due to human activity and greenhouse gases that runs across the MDO cycles.
‘This isn’t just a blip. We can expect colder winters for quite a while’. But he added: ‘I do not believe in catastrophe theories. Man-made warming is balanced by the natural cycles, and I do not trust the computer models which state that if CO2 reaches a particular level then temperatures and sea levels will rise by a given amount. These models cannot be trusted to predict the weather for a week, yet they are running them to give readings for 100 years.’
Prof Tsonis said that when he published his work in the highly respected journal Geophysical Research Letters, he was deluged with ‘hate emails’. He added: ‘People were accusing me of wanting to destroy the climate, yet all I’m interested in is the truth.’ He said he also received hate mail from climate change sceptics, accusing him of not going far enough to attack the theory of man-made warming.
The work of Profs Latif, Tsonis and their teams raises a crucial question: If some of the late 20th Century warming was caused not by carbon dioxide but by MDOs, then how much? Tsonis did not give a figure; Latif suggested it could be anything between ten and 50 per cent. Other critics of the warming orthodoxy say the role played by MDOs is even greater. William Gray, emeritus Professor of Atmospheric Sciences at Colorado State University, said that while he believed there had been some background rise caused by greenhouse gases, the computer models used by advocates of man-made warming had hugely exaggerated their effect. According to Prof Gray, these distort the way the atmosphere works. ‘Most of the rise in temperature from the Seventies to the Nineties was natural,’ he said. ‘Very little was down to CO2 - in my view, as little as five to ten per cent.’
But last week, die-hard warming advocates were refusing to admit that MDOs were having any impact. In March 2000, Dr David Viner, then a member of the University of East Anglia Climatic Research Unit, the body now being investigated over the notorious ‘Warmergate’ leaked emails, said that within a few years snowfall would become [a very rare and exciting event’ in Britain, and that ‘children just aren’t going to know what snow is’. Now the head of a British Council programme with an annual 10 million pound budget that raises awareness of global warming among young people abroad, Dr Viner last week said he still stood by that prediction: ‘We’ve had three weeks of relatively cold weather, and that doesn’t change anything. ‘This winter is just a little cooler than average, and I still think that snow will become an increasingly rare event.’
The longer the cold spell lasts, the harder it may be to persuade the public of that assertion.
Read more here.
-----------------------
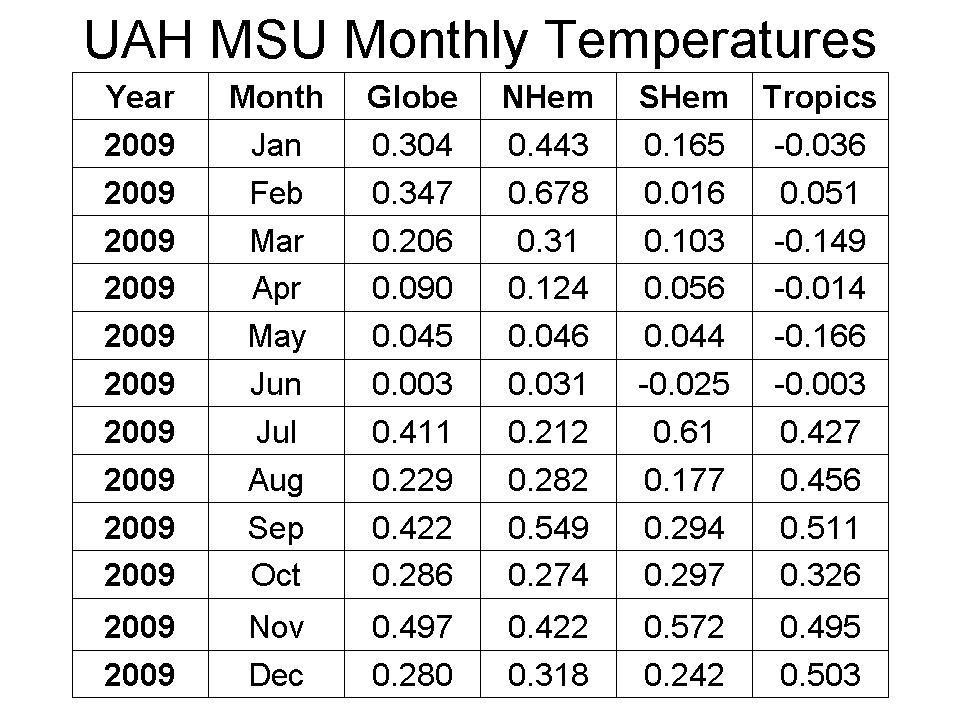
December 2009 UAH Global Temperature Update +0.28 Deg. C Down from +0.497 in November
By Dr. Roy Spencer, UAH

See enlarged here.

See enlarged here.
See enlarged image here.
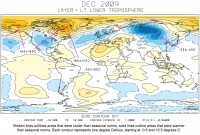
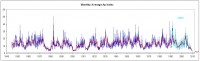
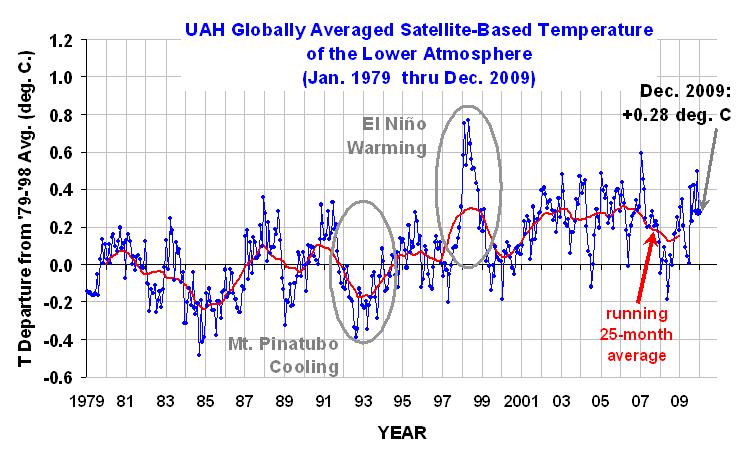
The global-average lower tropospheric temperature anomaly fell back to the October level of +0.28 deg. C in December. The tropics continue warm from El Nino conditions there, while the NH and SH extratropics anomalies cooled from last month. While the large amount of year-to-year variability in global temperatures seen in the above plot makes it difficult to provide meaningful statements about long-term temperature trends in the context of global warming, the running 25-month average suggests there has been no net warming in the last 11 years or so.

See enlarged here.

See enlarged here.
See more here.-----------------------
A Chilly December at the 700mb Level
By Dr. Richard Keen, University of Colorado
To paraphrase Led Zeppelin, “It’s been cooling, I ain’t fooling...”
December was a chilly month across much of the U.S., and at my site (the NWS co-op station for Coal Creek Canyon, Colorado, NW of Denver at an elevation 8950 feet, or 720 millibars, December was the coldest December (and the coldest month of any name) in 27 years of record. The average of 16.5 was 0.8 degrees colder than December 1983. Over the entire record, nine months averaged colder than 20F; of these, five occurred during 1983-1990, none during 1991-2005, and four during 2007-2009. It appears that he warm spell of the 1990’s and early 2000’s has ended.
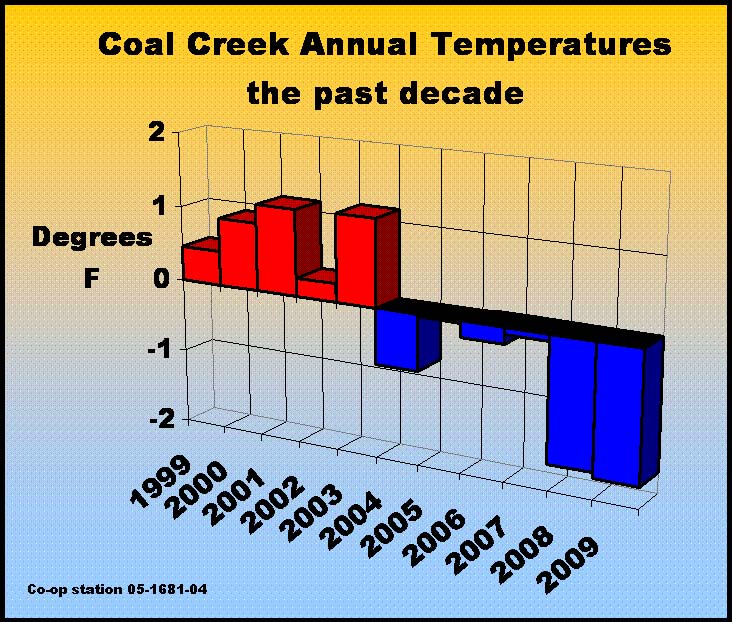
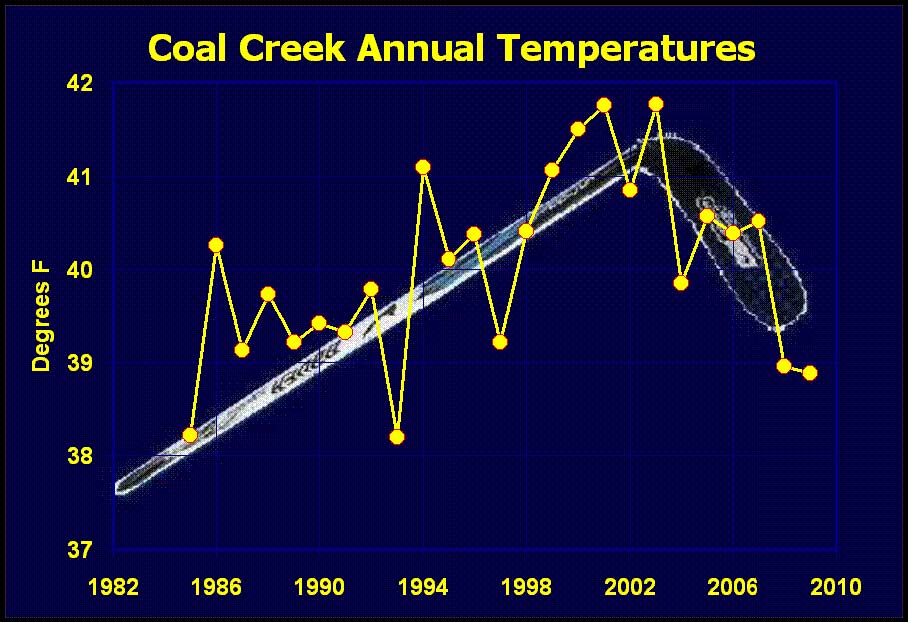
Here’s a chart of the past decade of annual temperatures (CoalCreekCO2009), updating my post from a year ago. The recent cooling trend continues, with 2009 coming in at 38.9F, colder than 2008 and a full 3 degrees F colder than 2003. The “Tipping Point” in 2003-2004 is clear on the updated graph.

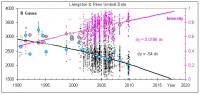
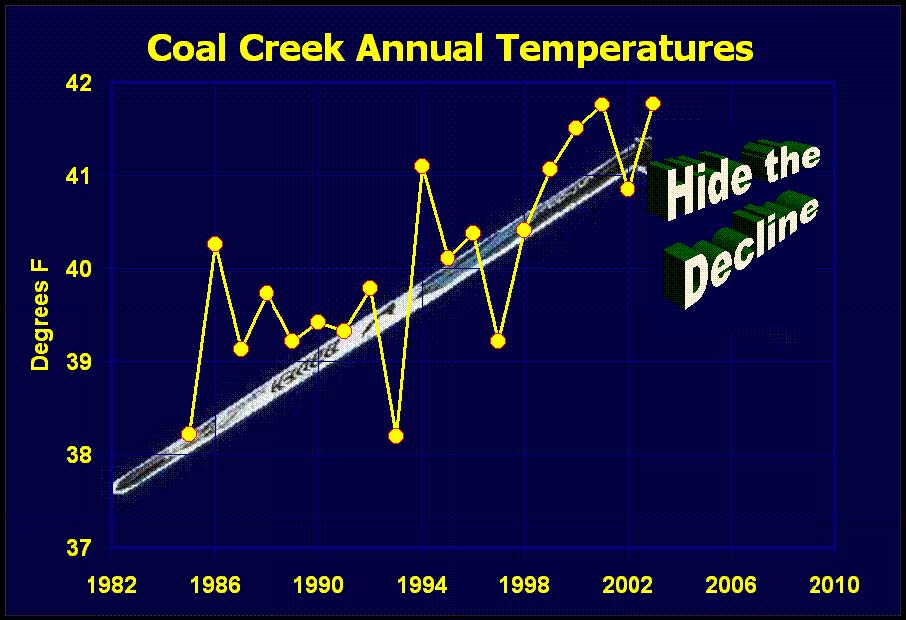
The longer record at my location (CCMONTH_Hide decline anim) shows the Tipping Point more dramatically through the miracle of animation. The added trend line is from a special “best fit Hockey Stick” code I found in some downloaded e-mails last month, although I had to alter the code to change the angle of the blade.

Enlarged here.

Enlarged here.
After last January’s post, someone commented on “Watts Up With That?” that (s)he “didn’t really think [Anthony Watts] couldn’t scrape up any less significant data”. I was heartbroken with the thought that my 10,059 daily max and min temperatures could be the least significant atmospheric observations ever made. So allow me to put the record from my particular station in perspective.
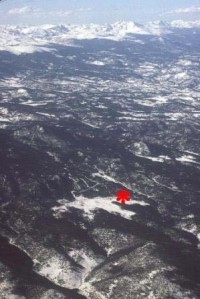
The site is about 60 miles from the geographic center of Colorado, and a couple of thousand feet higher than the average elevation of the state. The aerial photo of the site (marked by the red asterisk) looks to the northwest (Coal Creek aerial). Following is a table of correlation between Coal Creek Canyon annual means and measurements of annual temperatures for the entire state of Colorado.
Correlation R between Coal Creek Canyon and:
0.92 NCDC Statewide Divisional average
0.89 GHCN and Hadley gridded temperatures (the two were so similar they were averaged together)
0.91 NCAR-NCEP Reanalysis gridded temperatures
0.95 Average of all three
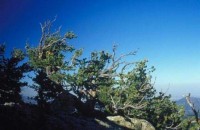
These correlations are much better than those of any Bristlecones with that other Hockey Stick. Although there’s bristlecones a short hike from my house (picture - bristlecone small), I leave them alone. With a correlation R = 0.95. the Coal Creek station is pretty representative of the entire state of Colorado. Colorado, in turn, is in the Rocky Mountain and intermountain West, a region projected by the IPCC to have the greatest warming in the “lower 48” states - about 4C, or 7F, over this century (see part of IPCC fig-11-8-3). According to the IPCC models, greenhouse gas warming should be greatest over continental interiors and in the middle troposphere, so Coal Creek Canyon is an ideal “global warming” monitoring site. How, then, is the projected 0.7F per decade warming coming along?
Since 1985, the overall trend has been +0.3F per decade, about half of the IPCC projection. Since 2000, the trend has been -3F per decade - four times greater than the IPCC projection, and in the opposite direction!
This is an example of how one station’s data can be significant for assessing climate change, but only if the station is carefully installed and maintained, is in a location relatively free of non-climatic influences, has records that are diligently kept, and, above all, does not have its records mysteriously altered. It would be instructive to see records from other observers who have quality records of long duration.
Richard Keen, Ph.D.
Coal Creek Canyon, Colorado
See PDF here.